Project repository here.
In 2017, Brazil was shaken by the JBS corruption scandal, one of the largest political scandals in the country's history. The involvement of the JBS group, one of the world's largest meat processing companies, and its executives in allegations of bribery and corruption led to a political crisis that threatened to bring down President Temer's government. The scandal revealed the extent of corruption in Brazilian politics and the deep connections between business interests and political power.
The scandal was triggered by a secret recording made by JBS executive Joesley Batista, in which President Temer appeared to endorse the payment of hush money to former House Speaker Eduardo Cunha. The recording became a key piece of evidence in the investigation into the JBS corruption scandal, which resulted in the arrest of several high-ranking politicians, including former Presidents Lula da Silva and Dilma Rousseff.
"I wanted to leverage the knowledge I had to uncover the truth!"
During that same time, I stumbled upon an article on the Data Science Central website about detecting emotions in facial expressions from a video input of the prime minister of Pakistan during an address to the nation regarding the Panama Papers. When President Temer made a speech to explain his alleged involvement in the JBS scandal, I knew I had to try to discover what he was feeling during that speech! I wanted to leverage the knowledge I had to uncover the truth!
Project goal
The goal was to see if I could obtain information about President Temer's emotional state during his speech and be able to analyze it.
Implementation
This project was developed back in 2017, so I used Python 2.7 to connect with Microsoft Cognitive Services Emotions API and process the results, R and ggplot2 to make visualizations (I preferred ggplot rather than Python viz libraries at that time) and ultimately Adobe Photoshop and After Effects to mash the graphs and video of the speech together (no, there wasn't gganimate back then 😆).
The Python script connected to the API, which would analyze the video and return the probabilities for each of eight emotion categories - anger, contempt, disgust, fear, happiness, neutral, sadness and surprise - for each frame of the video in a JSON file. The file was processed and the results sent to RStudio to generate the visualizations.
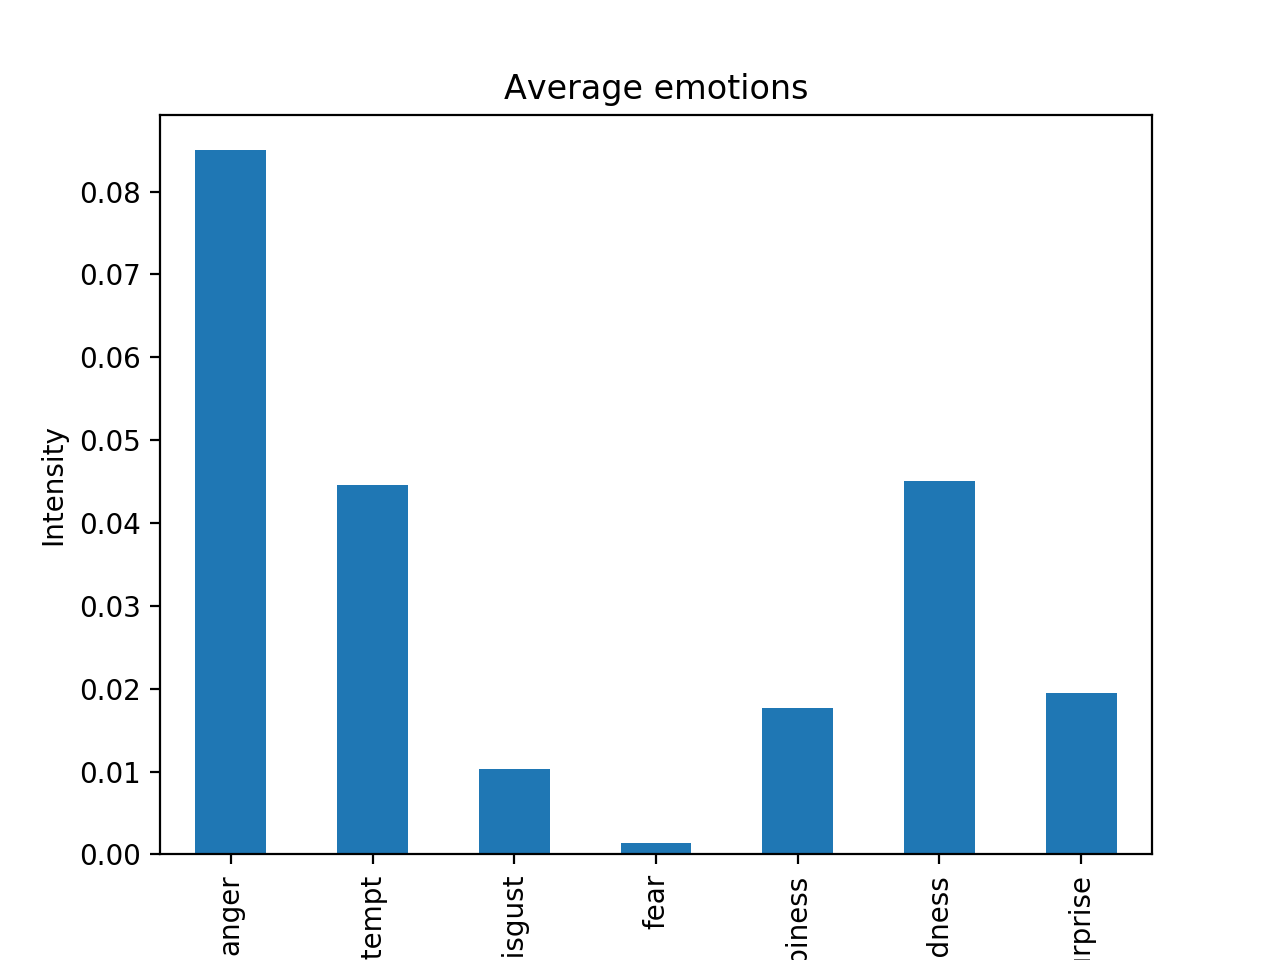
The image below is a bar chart containing the average value of each emotion for the whole video.
 Bar chart of President Temer's emotions. Was he not in fear?
As it can be seen from the results, Temer wasn't very happy with the situation, as one would expect to be the case.
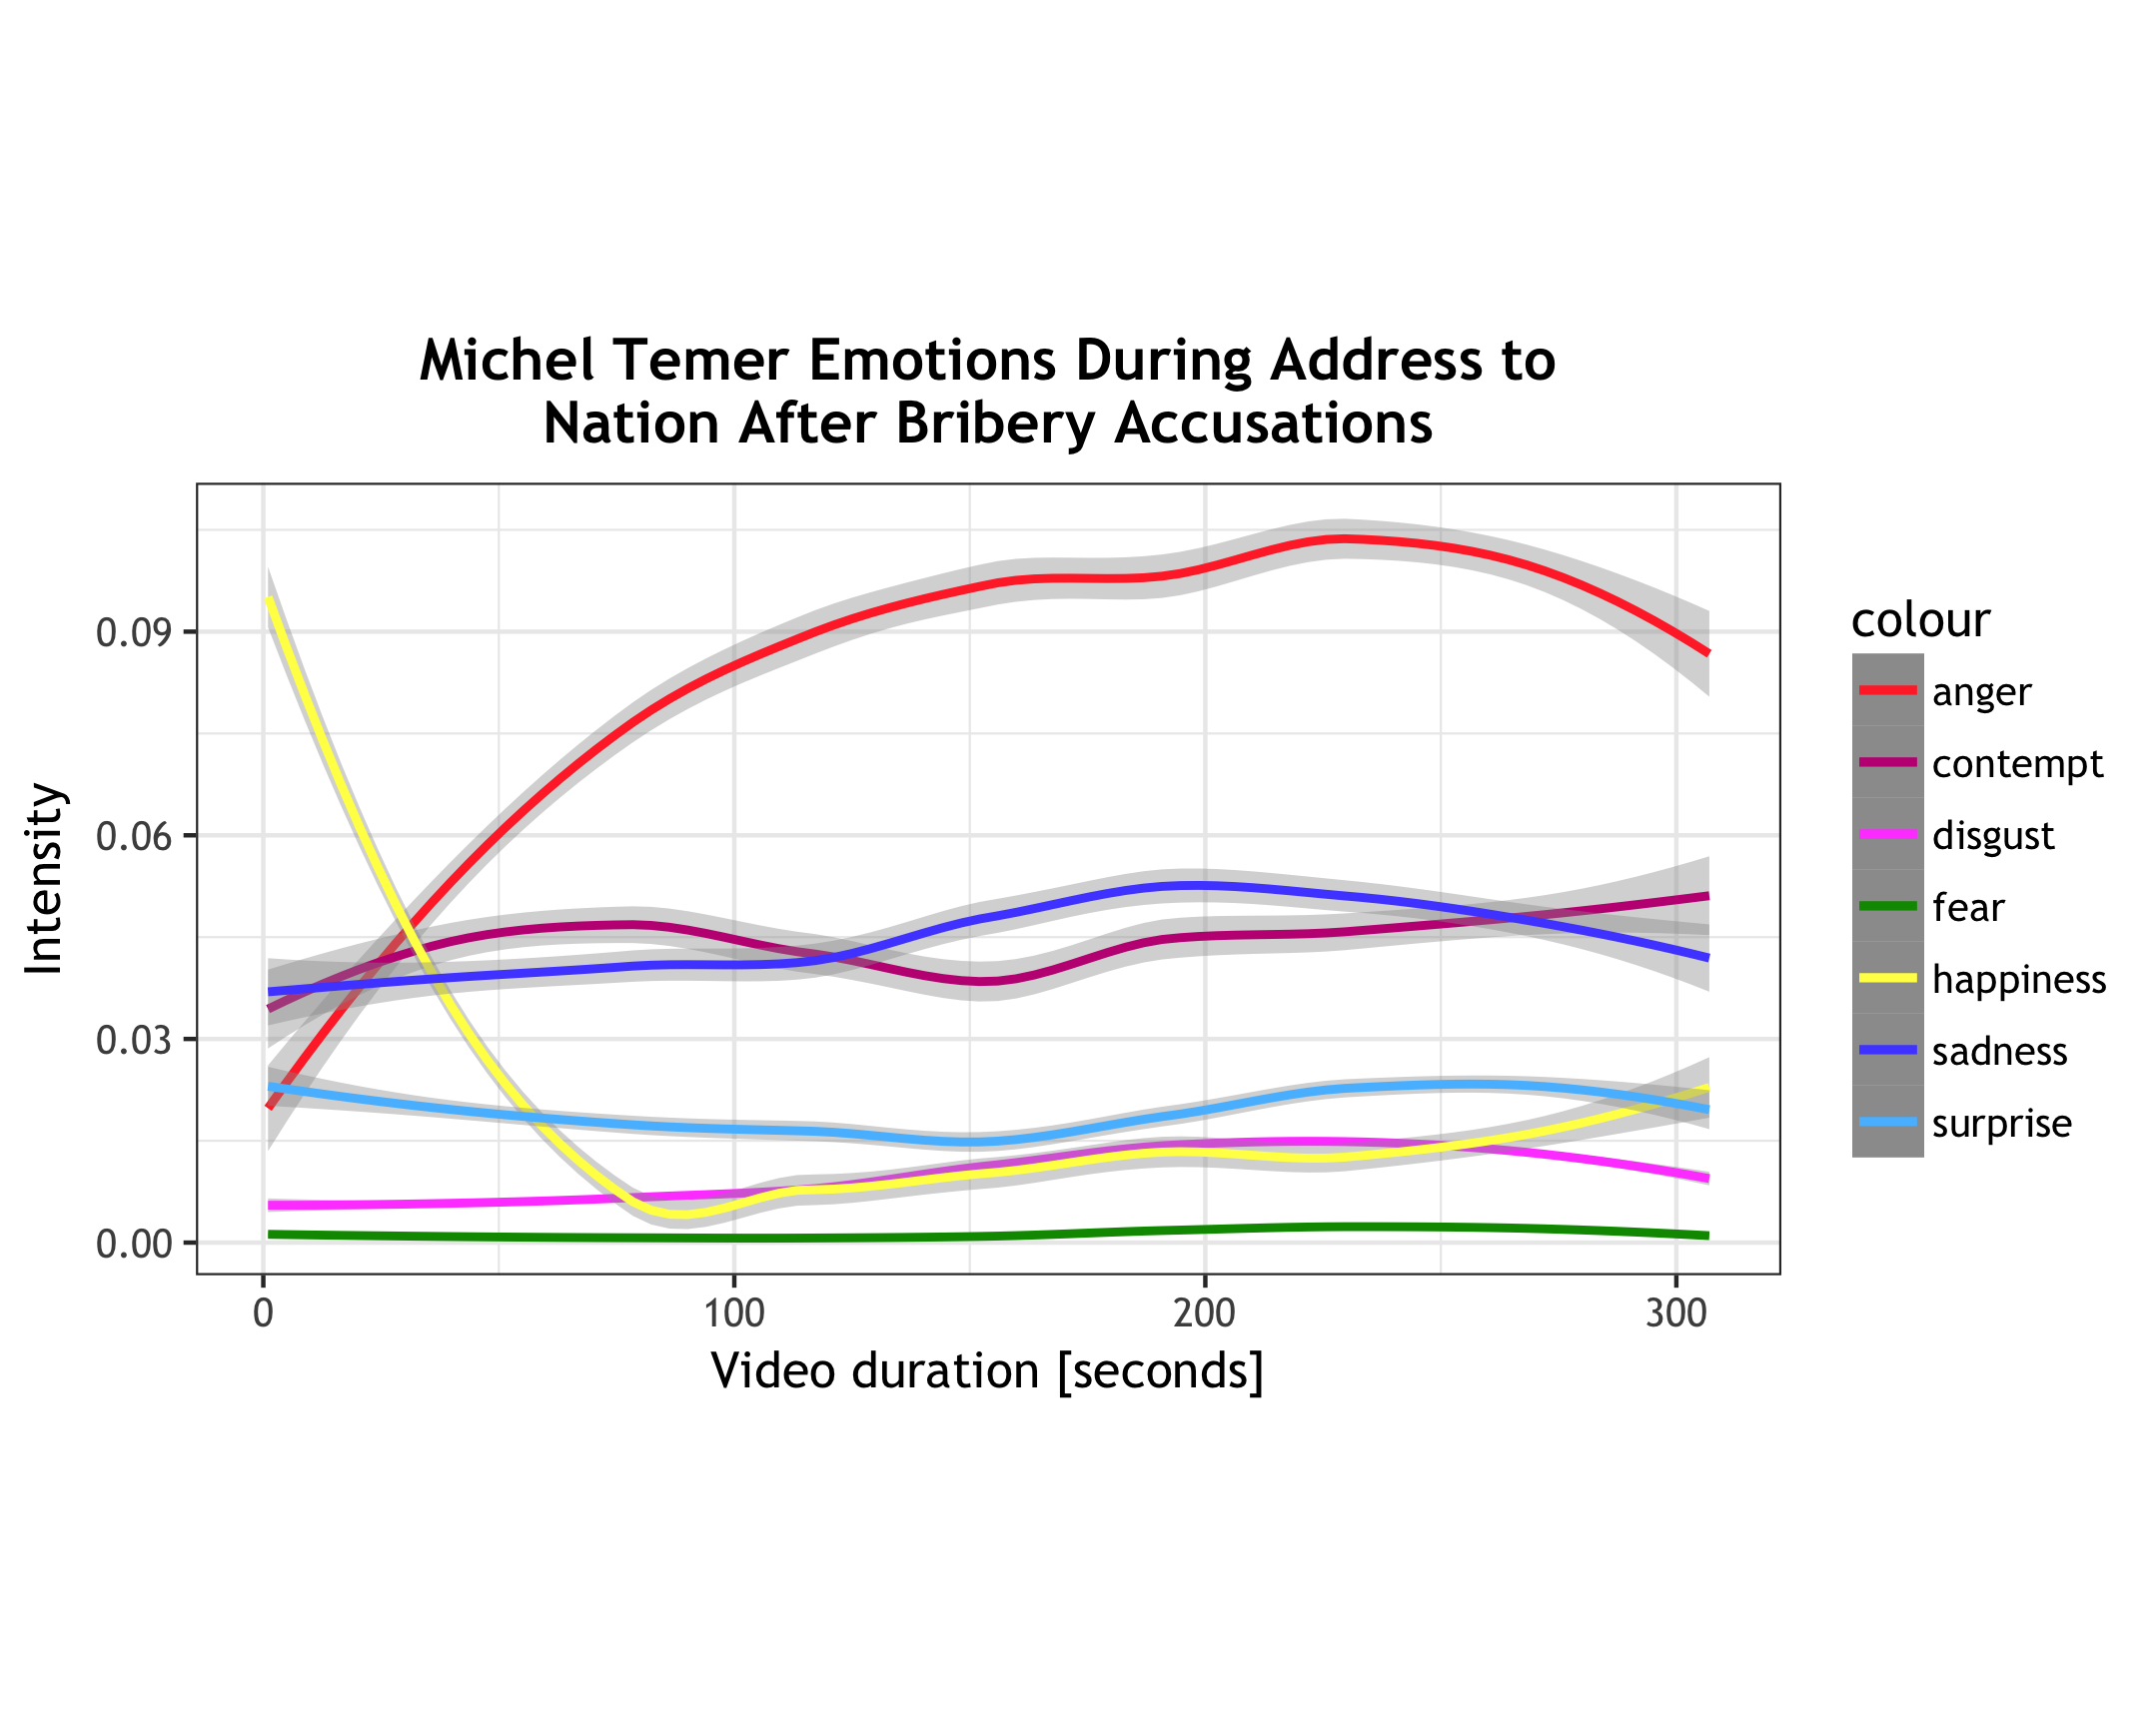
The chart above does a good job of providing an overview of the emotions for the situation as a whole. In addition, a line chart was created in R using the ggplot2 library to display the intensity of the emotions for each frame. This way, we can see how they progress as the speech unfolds.
 Evolution of each emotion during the speech.
To make it easier to associate the emotion progression with the corresponding moment in the video, I put the two together and added a progress bar using Adobe After Effects. The result can be seen in the video below.
This was a fun quick project I whipped up when I was taking my first steps in the path of data science. Nevertheless, it goes to show the potential these tools have and how they can be used for many different applications, including for social sciences and possibly even shaping democracies, for better or worse.
Fast forward 5 years since this project was created, now we have much more advanced AI and efficient machine learning technologies, which means even more possibilities then before. How do you FEEL about it?
Photographs by Unsplash.